
ETH breakout this week? Chart Analysis
- Travis Harbin

- Aug 7, 2022
- 3 min read
What's UP with ETH?

Ethereum is turning heads as it turns up off a triple-tap from its earliest key support level dating back to early 2021.
- ETH daily overview with a few obvious horizontal key levels marked.
-Also a channel drawn is depicting the possible breakout over the next week.
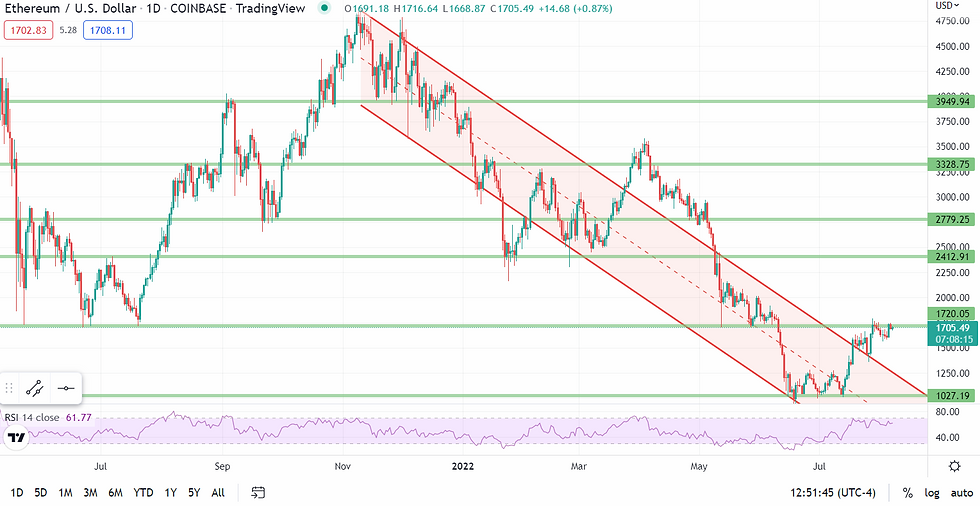
Note- The market has already broken out of the channel and retested with confirmation of a turnaround in the upward direction. Now I'd consider scaling into an entry between current price and another retest of the channel which matches with the bottom key level (roughly 1027) if I were interested in a long position. ETH breaking above the current ceiling being tested (1720) and most likely using it as support would add to my confidence in the upward move. Also take into consideration that a stop or the ability to downsize the position if ETH breaks under the 1027 level may be a bright idea to avoid holding onto an extension of this bearish run we've experienced all year. On the other side of that coin- if your fundamental background analysis gives you reason to believe ETH is headed back up, then you may be one still adding to ETH as it drops into the future- please know and calculate your own risk level when trading.
image- Zoomed out to show there is little to nothing holding the market up under the 1027 mark on the bottom

What do others see?
Now that we've glanced at what is obvious, let's take a brief look at what a couple other styles of trading tools show- Fibonacci, RSI, and regression channels
Fibonacci
Retracement tool large down move-

Retracement tool recent down move-

Fib retracement conclusions-
Measuring from the large down move shows we have only retraced about 20% from the ATH at the beginning of the year. Measuring from the most recent move still leaves us short of the 38.2% standard many will look for in a pull back (retracement).
Overall- Noting the overall downtrend, the market still has room to go up and continue the perfect downtrend. Digging deeper advice- don't hold onto the idea the market HAS to go back up if we start turning and heading down after an upward swing- it may be a necessary play before the market picks up shorts and heads for rock bottom. Beware the eyes of FOMO.
Fib Extensions of current move up-

RSI
Standard RSI on the daily is showing the market bouncing off the overbought mark at 70. We have slight divergence as the market made a recent Higher high on the charts where the RSI is showing a Lower High (shown in image). This divergence implies that the market may be overextended and unable to hold its current path outside of the channel it has recently broken.

Regression channel-
1 standard deviation

2 standard deviation

Regression channel of down move conclusion-
The market is trying to hold upward outside of the 1sigma regression channel for the second time in this down move, but it has remained within the 2sigma throughout.
2 ways of interpreting this-
A. the market is trying to hold upward again and may be breaking out to the upside
B. the market is due for a bearish move and stretched to the upside again in this downtrend
The same regression tool flipped as a predictive tool from the most recent move up shows ETH reaching 3000 around early November if the current move continues up its recovery path.

Ask the Audience
Quick survey for all- you may see results after answering.
Will ETH reach $3000 by year end?
Yes, ETH will again reach $3000/ETH before 2023
No, ETH will not be able to get back to $3K by year end.
Undecided, I am here to learn and offer no opinion
Conclusion-
We all know crypto is risky at the moment. If this is news to you the internet search engine can be your friend as you dig down the rabbit hole of what has happened with crypto markets overall this year. Ethereum’s recent upward swing is just as likely to be a retracement in a downtrend as it is the beginning of an uptrend if you only look at the charts. Overconfidence in any market, especially crypto, can be the downfall of any trader. Develop a plan and stick to it.
Thank you for your time!
FNL T
8/7/2022
visit FuturesNetworks.com for more info on how you can develop your own trading zone over time.
-----------------------------------------------------------------------------------------------------------------------------------------
FNL content including, but not limited to, articles, podcasts, videos, live streams, and websites are intended for informational purposes and should NOT be considered financial, investment, nor trading advice. Cryptocurrency, futures, foreign currency and options trading contains substantial risk and is not for every investor. An investor could potentially lose all or more than the initial investment. Risk capital is money that can be lost without jeopardizing one’s financial security or lifestyle. Only risk capital should be used for trading and only those with sufficient risk capital should consider trading. Past performance is not necessarily indicative of future results. https://futuresnetworks.live/risk_disclaimer

Comments